

spe_LST_2022-04-27_AP2.0e-4#
The full file can be found in the Simulation Model repository here.
The first 30 lines of the file are:
# Original name: spe_with_prompt_from_Mitsunari.dat
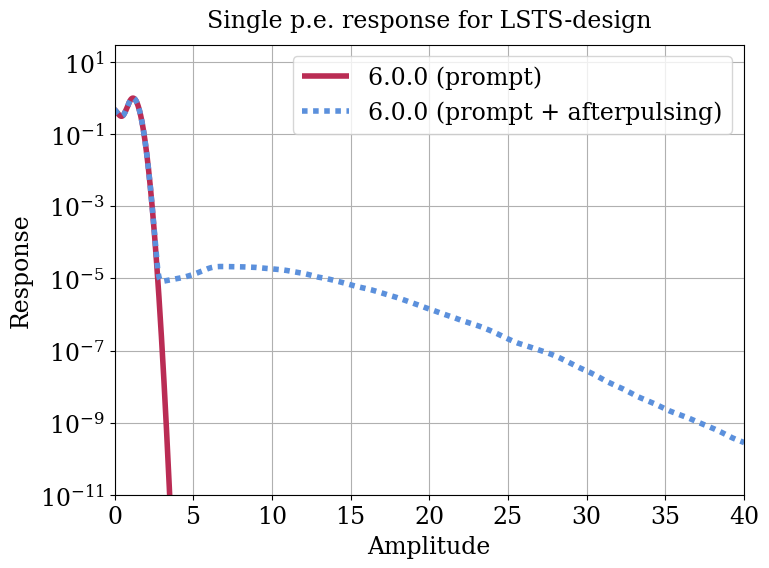
# Prompt response by Takahashi Mitsunari, 2020-12-21
# Afterpulse spectrum folded in by Orel Gueta, 2022-04-27
#
# Norm_spe processing of single-p.e. response.
# Table with 250 rows has been read from file SinglePhe_spectrum_totalfit_19pixel-average_20200601.dat
# Scaling x axis by factor 0.995334
# Scaling y axis by factor 0.0527663
# Folding in afterpulse spectrum from file 'LST_afterpulses.dat' enforcing uniform
# sampling of 2011 steps of size 0.019907 from 0.009953 to 40.022379.
# Afterpulse ratio (prompt x AP folded) above 4.000000 mean p.e.: 0.000194
# Mean(prompt) = 1.000, peak at 1.174 (sum=1.000)
# Fraction of events below 10% of mean: 0.044
# Fraction of events below 20% of mean: 0.083
# Fraction of events below 30% of mean: 0.117
# Sqrt(Excess noise factor): 1.103, ENF = 1.216
# Note: collection efficiency losses should be included in low amplitude signals.
# Rebinning to 2101 uniform steps of size 0.020000 from 0.000000 to 42.000000.
0.000000 0.4694 0.4694 %%% original: 0.010000 8.8958
0.020000 0.46378 0.46378 %%% original: 0.030000 8.6848
0.040000 0.45267 0.45267 %%% original: 0.050000 8.4766
0.060000 0.44172 0.44172 %%% original: 0.070000 8.2716
0.080000 0.43095 0.43095 %%% original: 0.090000 8.0701
0.100000 0.42037 0.42037 %%% original: 0.110000 7.8725
0.120000 0.41002 0.41002 %%% original: 0.130000 7.6793
0.140000 0.39991 0.39991 %%% original: 0.150000 7.4909
0.160000 0.39008 0.39008 %%% original: 0.170000 7.3079
0.180000 0.38055 0.38055 %%% original: 0.190000 7.1311