

LST_pulse_shape_7dynode_high_intensity_pix1s#
The full file can be found in the Simulation Model repository here.
The first 30 lines of the file are:
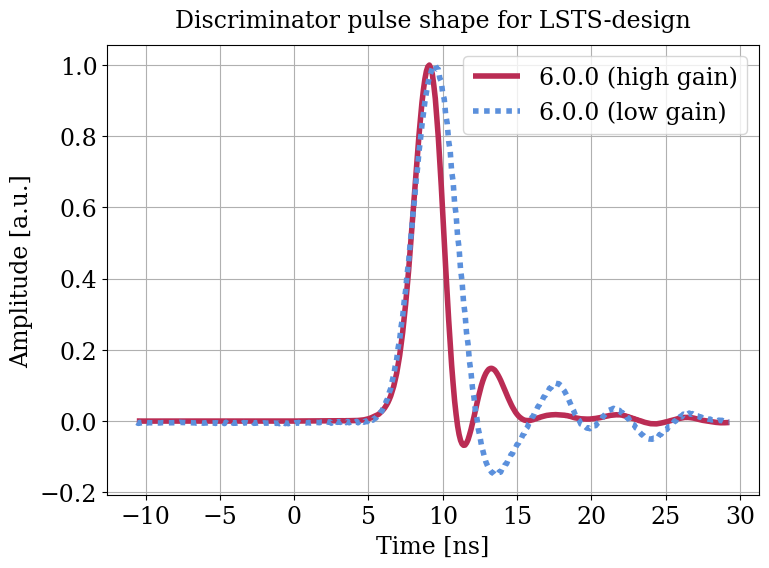
# These are the readout pulse shapes for LST2-4.
# The pulse shapes are measured at laboratory, using a PMT module masked with a pinhole mask.
# The pinhole mask is used to reduce effect of transit time spread when measuring multi p.e. signal
# so that the multi p.e. pulse shape can be regarded as that for single p.e. signal
# All the seven PMTs attached to the module show similar pulse shape.
# This file contains the pulse shape from a typical PMT.
# The columns of time_hg and ampl_hg represent time [ns] and amplitude [a.u.] for the high gain pulse shape, respectively.
# time_lg and ampl_lg are the same quantities for the low gain channel.
# The time is calculated with respect to the 10%-rising point of each pulse shape.
#
# Original file contributed by Yukiho Kobayashi, 2022-05-17.
# Modifications by KB, 2022-05-22:
#    - Common time column for HG and LG
#    - Shift time column by 6.8 ns to align peak position with pulse_LST_8dynode_pix6_20200204.dat

# time   ampl_hg         ampl_lg

-10.6	 0.000087	-0.004123
-10.5	-0.000018	-0.006603
-10.4	 0.000026	-0.003732
-10.3	-0.000072	-0.005308
-10.2	-0.000079	-0.004418
-10.1	-0.000027	-0.006720
-10.0	 0.000052	-0.004832
 -9.9	-0.000072	-0.005486
 -9.8	-0.000017	-0.004428
 -9.7	-0.000081	-0.004866
 -9.6	-0.000122	-0.004879
 -9.5	-0.000027	-0.004997
 -9.4	-0.000201	-0.004720