

spe_afterpulse_pdf_NectarCam_18122019#
The full file can be found in the Simulation Model repository here.
The first 30 lines of the file are:
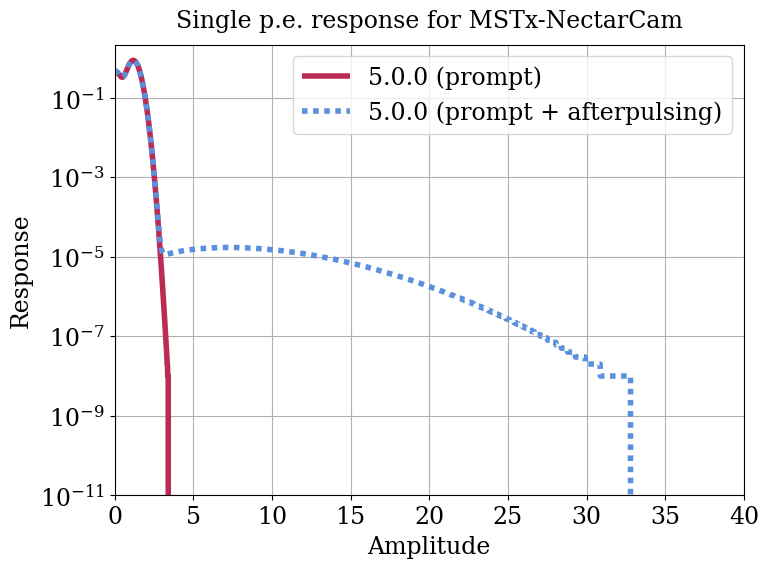
# NectarCam single-p.e. response (prompt and with afterpulse),
# presented by Thomas Tavernier 2020-02-13.
# Data table by Thomas Armstrong 2020-04-17.
#
# Check summary by 'norm_spe -NN' (not changing table):
# Not scaling x axis by factor 0.999137
# Not scaling y axis by factor 1.0004
# Mean(prompt) = 1.001, peak at 1.181 (sum=1.000)
# Fraction of events below 10% of mean: 0.048
# Fraction of events below 20% of mean: 0.093
# Sqrt(Excess noise factor): 1.118, ENF = 1.249
# Note: collection efficiency losses should be included in low amplitude signals.
#
# Afterpulse fraction above 4 mean p.e.: 0.000176
# Afterpulse fraction above 4 peak p.e.: 0.000166
#
# Amp.   Prompt pdf      Prompt +
# [<pe>]                 afterpulses
#
0.0000	 0.46659815 	 0.46659815
0.0172	 0.46675299 	 0.46675305
0.0345	 0.46600571 	 0.46600584
0.0517	 0.46437850 	 0.46437870
0.0690	 0.46190116 	 0.46190143
0.0862	 0.45861100 	 0.45861133
0.1034	 0.45455263 	 0.45455303
0.1207	 0.44977775 	 0.44977821
0.1379	 0.44434482 	 0.44434535
0.1552	 0.43831869 	 0.43831929
0.1724	 0.43177016 	 0.43177083