

spe_LST_2020-05-09_AP2.0e-4#
The full file can be found in the Simulation Model repository here.
The first 30 lines of the file are:
# Norm_spe processing of single-p.e. response.
# Table with 350 rows has been read from file SinglePhE_ResponseInPhE_expo2Gaus.dat
# Cut-off of prompt single-p.e. spectrum above amplitude 2.250000 (before
# scaling) with s=0.120000, s2=0.500000
# Scaling x axis by factor 1.00145
# Scaling y axis by factor 96.8697
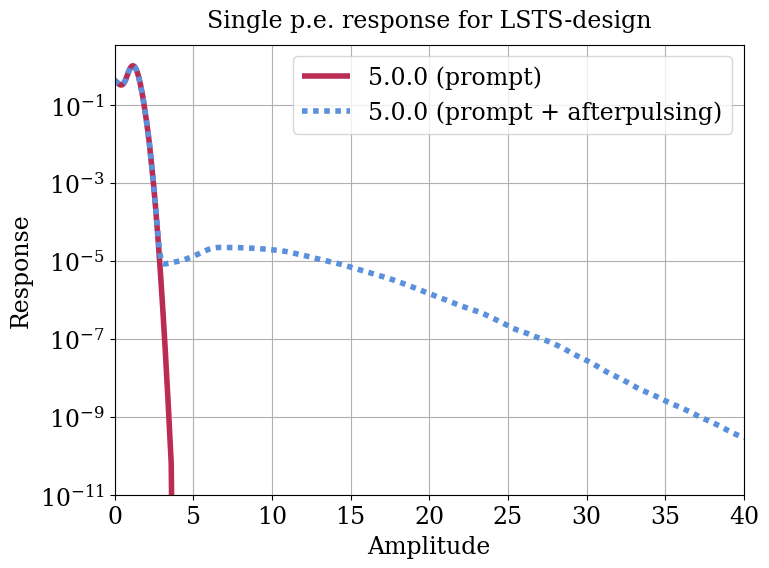
# Folding in afterpulse spectrum from file 'LST_afterpulses.dat' enforcing uniform
# sampling of 4052 steps of size 0.010366 from 0.005183 to 41.996304.
# Afterpulse ratio (prompt x AP folded) above 4.000000 mean p.e.: 0.000200
# Mean(prompt) = 1.000, peak at 1.171 (sum=1.000)
# Fraction of events below 10% of mean: 0.038
# Fraction of events below 20% of mean: 0.077
# Fraction of events below 30% of mean: 0.109
# Sqrt(Excess noise factor): 1.102, ENF = 1.214
# Note: collection efficiency losses should be included in low amplitude signals.
# Rebinning to 2101 uniform steps of size 0.020000 from 0.000000 to 42.000000.
0.000000 0.42264 0.42264 %%% original: 0.005175 0.004363
0.020000 0.41713 0.41713 %%% original: 0.015526 0.004323
0.040000 0.40983 0.40983 %%% original: 0.025877 0.0042836
0.060000 0.4027 0.4027 %%% original: 0.036227 0.0042446
0.080000 0.39575 0.39575 %%% original: 0.046578 0.004206
0.100000 0.38898 0.38898 %%% original: 0.056928 0.004168
0.120000 0.38238 0.38238 %%% original: 0.067279 0.0041304
0.140000 0.37598 0.37598 %%% original: 0.077630 0.0040934
0.160000 0.36978 0.36978 %%% original: 0.087980 0.0040568
0.180000 0.36379 0.36379 %%% original: 0.098331 0.0040207
0.200000 0.36045 0.36045 %%% original: 0.108682 0.0039851