

qe_lst2-4_20200318_high+low#
The full file can be found in the Simulation Model repository here.
The first 30 lines of the file are:
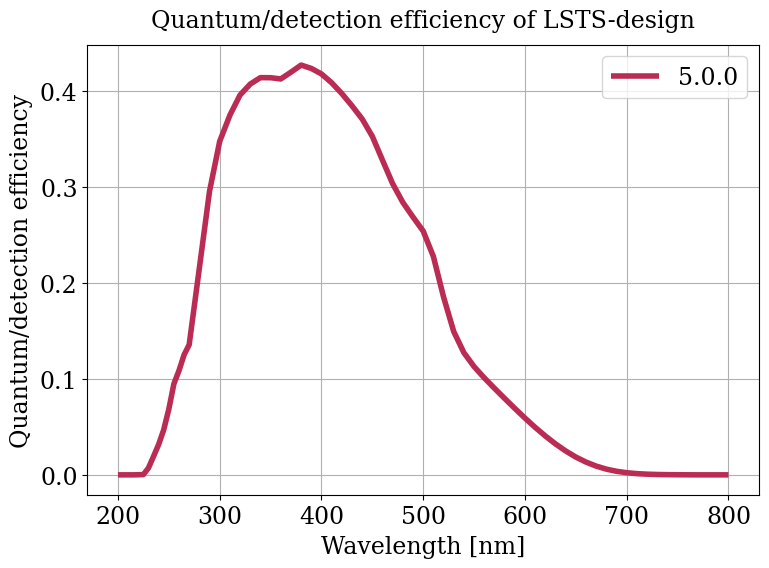
# High QE and low QE groups for PMTs in CTA North LST 2 to 4,
# as in file 'averaged_qe_curve_lst2-4_20200318.csv',
# originally from Shunsuke Sakurai (2020-03-18),
# based on QE values measured by Hamamatsu photonics,
# provided by Suda Yusuke 2020-04-09,
# and converted from percent to absolute QE values (KB).
# With extrapolation by other data at wavelengths below 270 nm (KB)
#
# Col. 1: Wavelength [nm]
# Col. 2: high_mean  (average)
# Col. 3: high_stdev (r.m.s.),  not used by sim_telarray
# Col. 4: low_mean   (average), not used by sim_telarray
# Col. 5: low_stdev  (r.m.s.),  not used by sim_telarray
#
200  0.0000          # Extrapolation from old prod-4 MST QE curve
205  0.0000          # Extrapolation from old prod-4 MST QE curve
210  0.0000          # Extrapolation from old prod-4 MST QE curve
215  0.0000          # Extrapolation from old prod-4 MST QE curve
220  0.0001          # Extrapolation from old prod-4 MST QE curve
225  0.0003          # Extrapolation from old prod-4 MST QE curve
230  0.0072          # Extrapolation from old prod-4 MST QE curve
235  0.0193          # Extrapolation from old prod-4 MST QE curve
240  0.0317          # Extrapolation from old prod-4 MST QE curve
245  0.0471          # Extrapolation from old prod-4 MST QE curve
250  0.0685          # Extrapolation from old prod-4 MST QE curve
255  0.0950          # Extrapolation from old prod-4 MST QE curve
# 260  0.1218          # Extrapolation from old prod-4 MST QE curve
# 265  0.1471          # Extrapolation from old prod-4 MST QE curve
# 250  0.0818886       # Extrapolation with data from Erlangen measurements
# 255  0.0939379       # Extrapolation with data from Erlangen measurements