

pulse_LST_8dynode_pix6_20200204#
The full file can be found in the Simulation Model repository here.
The first 30 lines of the file are:
# From file spe_response_masked_8dynode_pix6_20200204.dat
# provided by Suda Yusuke (MPP) 2020-02-19,
# data obtained by Y. Kobayashi (ICRR).
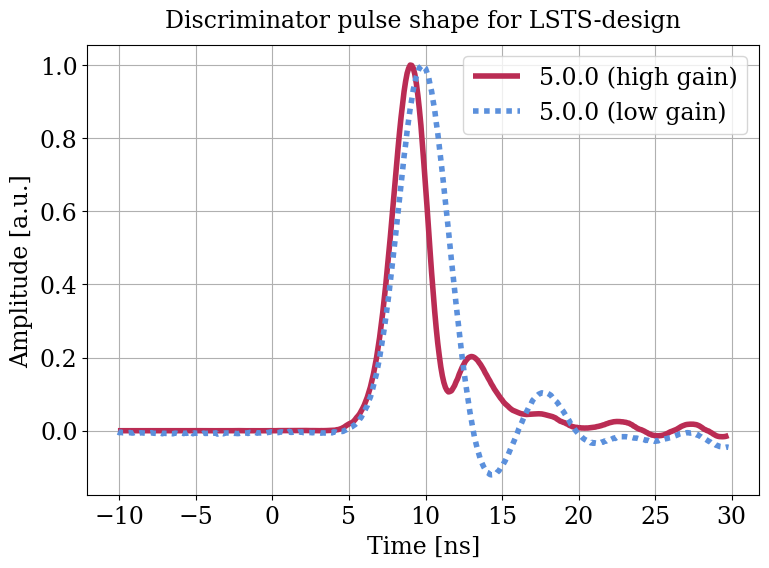
# The time axis was shifted by -5.1 ns (by K.B.) to
# align the peak position with the previous pulse shape
# (pulse_CTA-Fx3.dat), in order to keep read-out window position etc.
# unaffected.
# HG may also be used as an approximation for the trigger channel pulse shape.
# The HG pulse shape has an integral of 3.65164 ns at unit amplitude,
# while LG has 3.46371 ns.
#
# T[ns] HG (arb.) LG (arb.)
#
-10.10 -0.000142 -0.003785
-10.00 -0.000208 -0.005655
-9.90 -0.000071 -0.004016
-9.80 -0.000123 -0.005792
-9.70 -0.000059 -0.005634
-9.60 -0.000098 -0.005850
-9.50 -0.000095 -0.006019
-9.40 -0.000135 -0.005752
-9.30 -0.000106 -0.005245
-9.20 -0.000098 -0.006357
-9.10 -0.000071 -0.006422
-9.00 -0.000061 -0.004264
-8.90 -0.000047 -0.005679
-8.80 -0.000159 -0.005599
-8.70 -0.000012 -0.006610
-8.60 -0.000208 -0.005685
-8.50 -0.000012 -0.006197